Note
Go to the end to download the full example code.
Load and Plot Detected Events Across Stations#
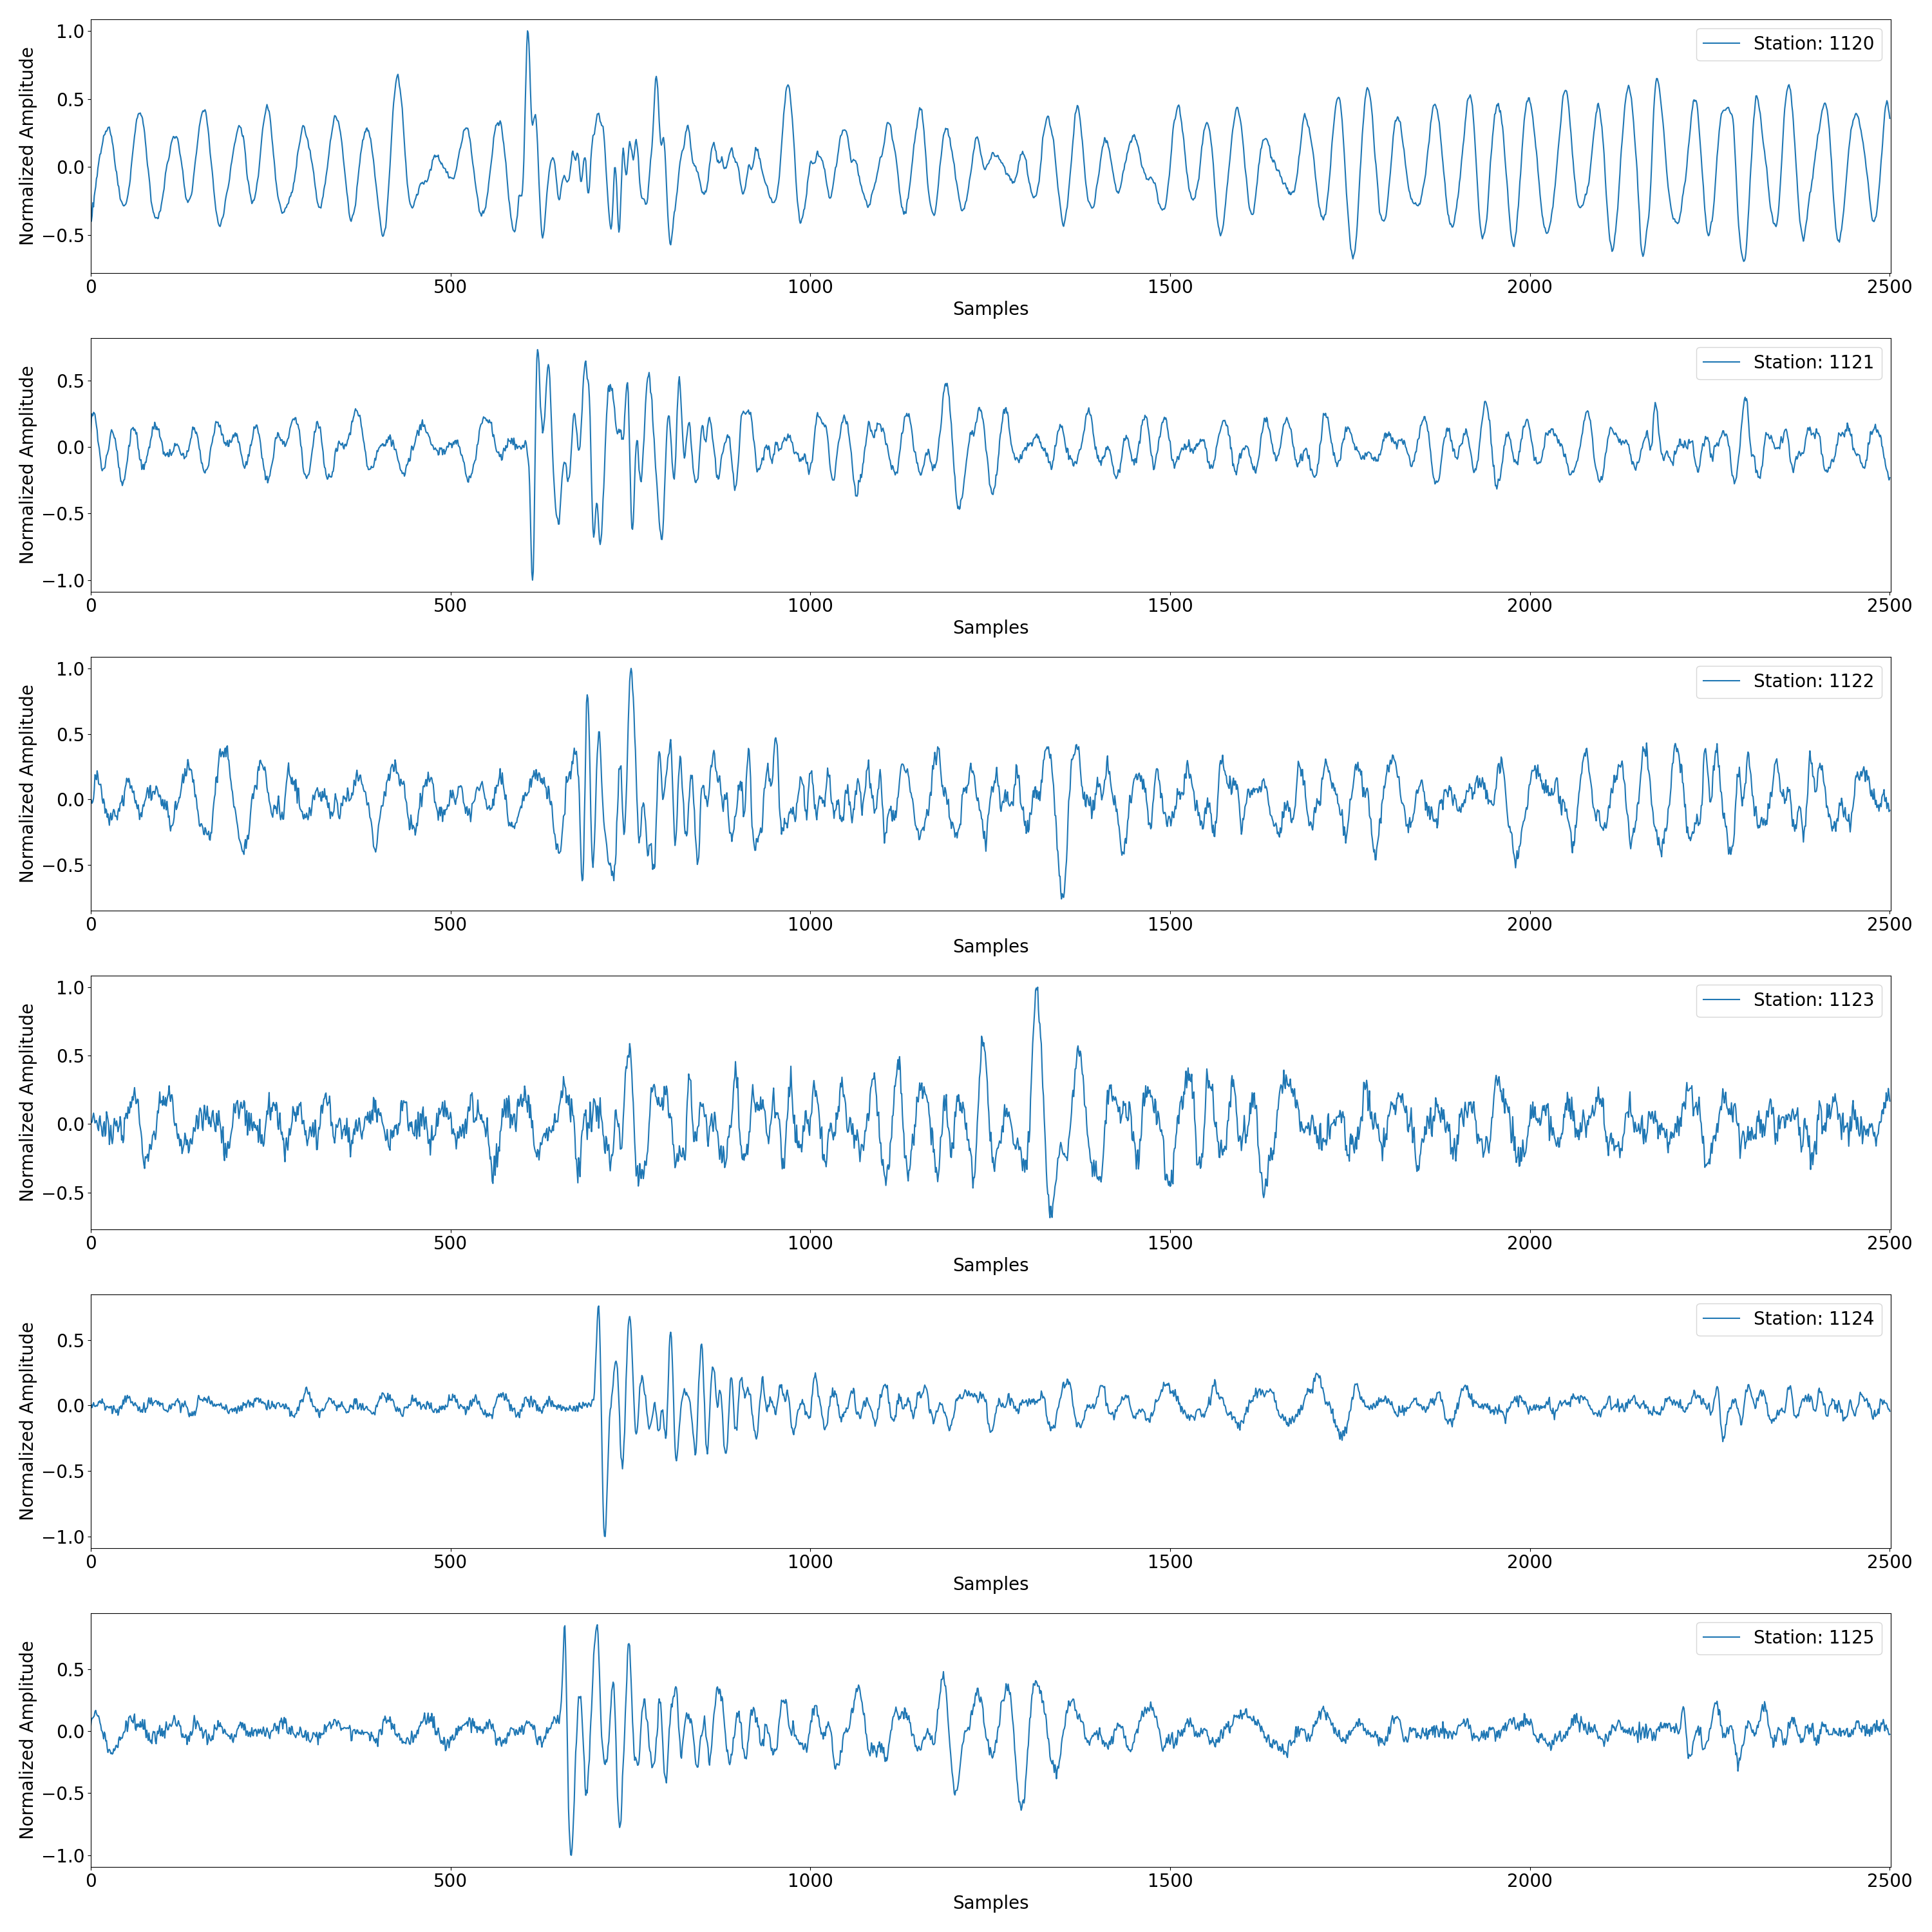
This script loads the results of associated detected seismic events saved in JSON format, retrieves the corresponding data for each detected station, and plots examples of 4-second segments starting from the detected times.
Example Usage#
To run this script, ensure that the output directory containing the associated detected events JSON file is correctly specified and populated with the necessary data.
import json
import os
import glob
import obspy
import matplotlib.pyplot as plt
import numpy as np
import random  # Import the random module for random selection
# For tracking time
from time import time
from datetime import datetime
from obspy import read
from obspy.clients.fdsn import Client
from fracspy.visualisation.Plotting_Detected_Events import *
Read Event Data Paths#
# Define client
client = Client("IRIS")
# Starting time of the event #1
t1 = obspy.UTCDateTime("2016-11-22T01:51:27")
# Add more time for inventory grabbing
t2 = t1 + 5
print(f"Time range: {t1} - {t2}")

station_list = [str(stationID) for stationID in range(1120,1130)]

# Get inventory
inventory = client.get_stations(network="5B", station="*",
                                starttime=t1,
                                endtime=t2)
# Get station codes
station_info = inventory.networks[0].stations
station_codes = []
for station in station_info:
    station_codes.append(station.code)

tr_data = []
start_time = time()
i = 0
for st_code in station_codes:
    if st_code in station_list:
        st = client.get_waveforms(network="5B",
                                  station=st_code,
                                  location="00",
                                  channel="DHZ",
                                  starttime=t1,
                                  endtime=t2)
        st = st.filter('bandpass', freqmin=1, freqmax=200, corners=4, zerophase=False)
        tr_data.append(st[0].data)
end_time = time()
print(f"Done! Loading time: {end_time - start_time} seconds")
Time range: 2016-11-22T01:51:27.000000Z - 2016-11-22T01:51:32.000000Z
Done! Loading time: 4.759623289108276 seconds
Plot Detected Events#
Plot the data segments.
num_stations_to_plot = 6
plot_station_data(tr_data, station_list, num_stations_to_plot)

Total running time of the script: (0 minutes 6.505 seconds)
