Note
Go to the end to download the full example code.
Seismic Wiggles Plotting#
This example shows how to visualise seismic trace data as wiggles. It is useful when working with data with a small number of traces.
import matplotlib.pyplot as plt
import numpy as np
import os
from fracspy.utils.sofiutils import read_seis
from fracspy.visualisation.traceviz import wiggleplot, multiwiggleplot


plt.close("all")
np.random.seed(0)
Data Loading#
Load data previously modelled using SOFI3D finite difference package
# Directory containing input data
input_dir = '../data/pyfrac_SOFIModelling'

# Load receiver geometry - required to know number of receivers
recs_xzy = np.loadtxt(os.path.join(input_dir,'inputs',
                                   'griddedarray_xzy_20m.dat')).T
nr = recs_xzy.shape[1]

# Modelling parameters
dt = 1e-3  # SOFI3D Time sampling rate

# Load the 3 component seismic data
expname = 'explosive_Homogeneous_griddedarray'
vz = read_seis(os.path.join(input_dir, 'outputs',
                            'su', f'{expname}_vy.txt'),
               nr=nr)
vx = read_seis(os.path.join(input_dir, 'outputs',
                            'su', f'{expname}_vx.txt'),
               nr=nr)
vy = read_seis(os.path.join(input_dir, 'outputs',
                            'su', f'{expname}_vz.txt'),
               nr=nr)
One-Component Wiggle Visualisation#
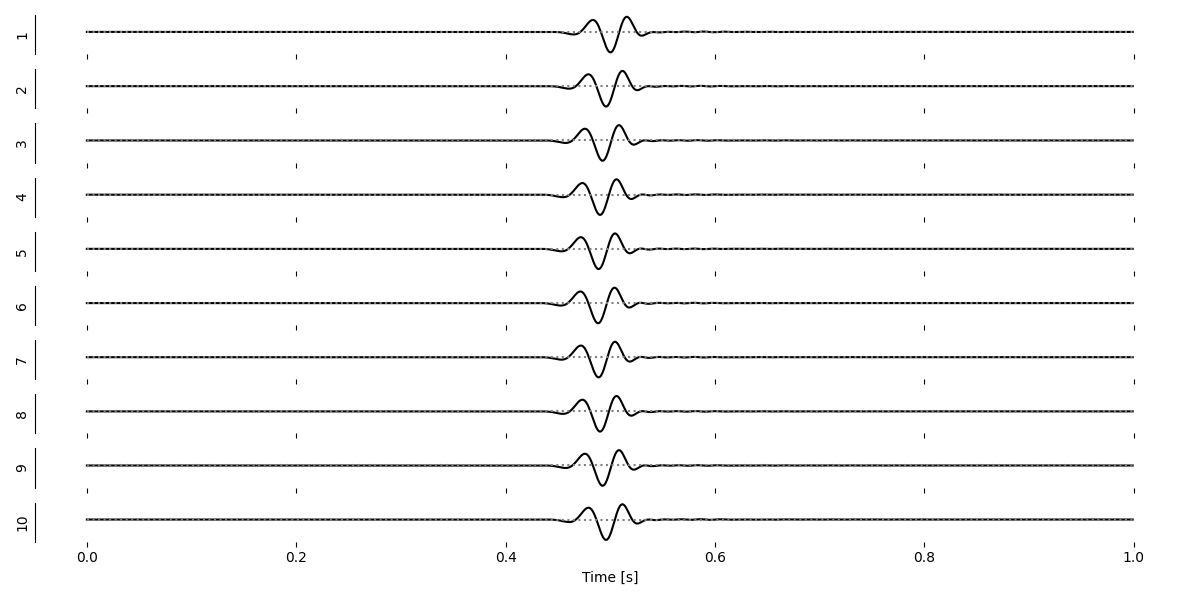
Where there are a relatively small number of traces (<40), wiggle plots can be particularly useful for identifying events. In this example we use:

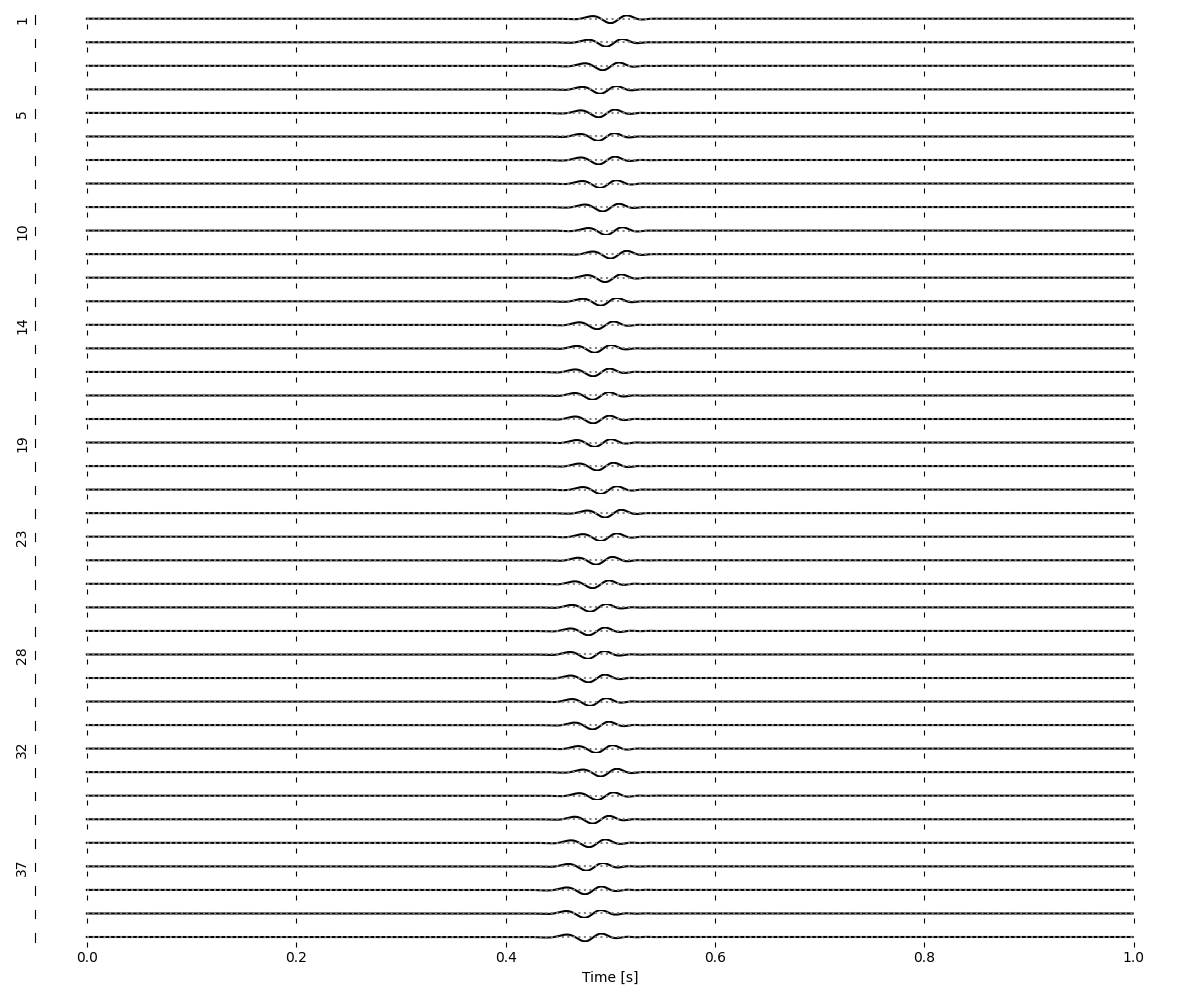
We can increase the number of traces, and the plot labels will adapt accordingly, to ensure the labels don’t overlap. As we increase the number of traces, it can make sense to also increase the vertical length of the figure (using the figsize arguement).

Multi-Component Wiggle Visualisation#
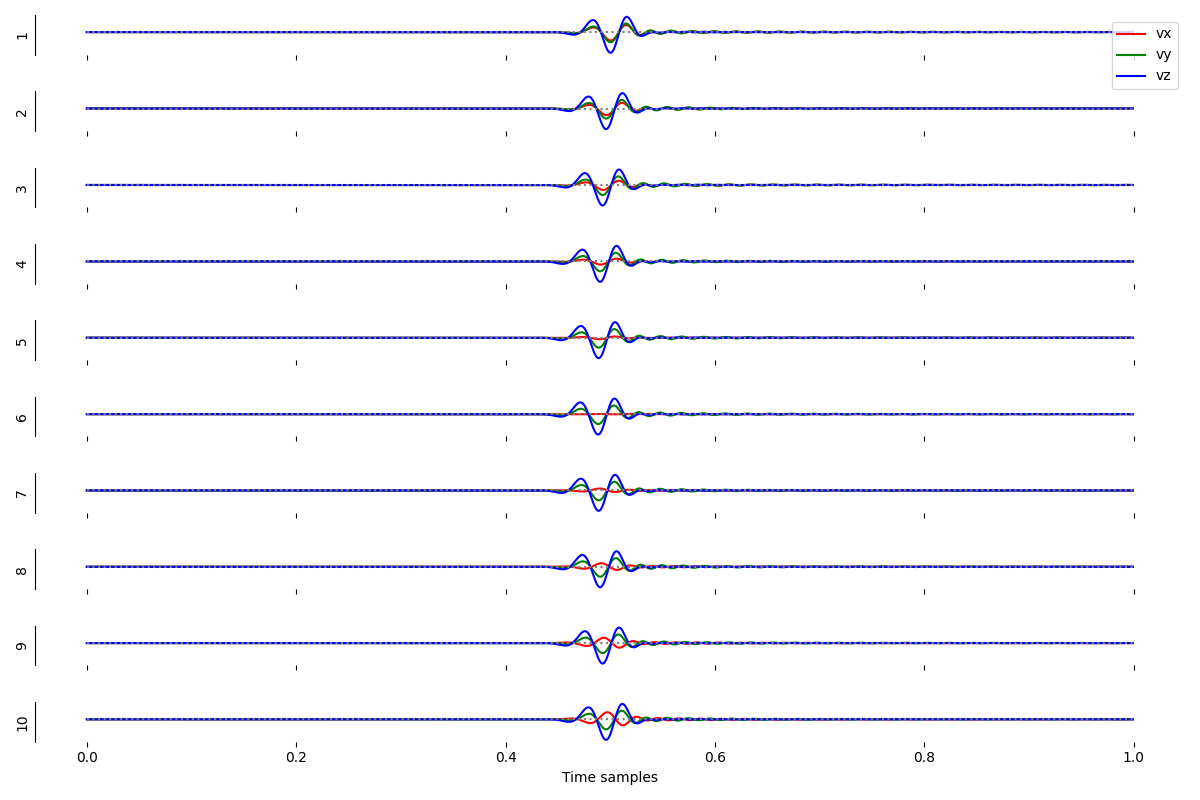
When working with 3 component data it can be very useful to overlay the different components. In this scenario, the plots can get overloaded very quickly, so we would advise sticking to a maximum of 10 traces.

Total running time of the script: (0 minutes 4.306 seconds)
