Note
Go to the end to download the full example code.
Moment Tensor Plotting - Matrix Style#
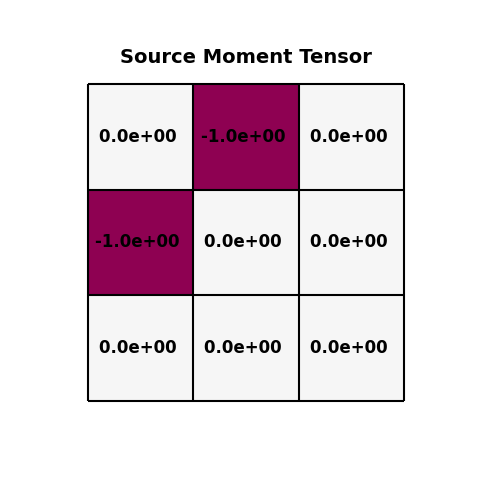
This example shows how to create a heatmap of the moment tensor matrix
import matplotlib.pyplot as plt
import numpy as np
from fracspy.visualisation.momenttensor_plots import MTMatrixplot


plt.close("all")
np.random.seed(0)
Let’s start by creating a moment tensor, as the moment tensor is a symmetric matrix we only need to define 6 of the 9 components
[0, 0, 0, -1, 0, 0]
We are going to visualise the moment tensor in its original 3-by-3 format, as a heatmap with the MT component values overlaid on top of their respective coordinate. Here we utilise the function: pyfrac.visualisation.momenttensor_plots.MTMatrixplot

Total running time of the script: (0 minutes 0.038 seconds)
