Note
Go to the end to download the full example code.
1.1 Template Matching Detection#
Overview#
This part of the code is designed to prepare templates for seismic event detection. It accomplishes this by reading event times from an event catalog and extracting the corresponding data from continuous seismic recordings. The primary aim is to save these extracted templates for each station, enabling their use in subsequent matched filtering analysis.
Methodology#
- Data Preparation:
The script reads continuous waveform data, that should be downloaded using the script in
“ToC2ME_WorkedExamples” directory. In this example the data will be downloaded on the fly - A band-pass filter is applied to the continuous data, targeting a frequency range of 1-200 Hz. - Event times from the catalog are utilized to extract corresponding templates, which are saved for each station. - Each extracted template is normalized to ensure a maximum absolute value of 1.
- Output:
Each template is stored as a NumPy file in a specified output directory.
import numpy as np
import matplotlib.pyplot as plt
import os
import json
import pandas as pd
import requests

import obspy
from obspy.core import UTCDateTime
from obspy import read
from obspy.clients.fdsn import Client
# For tracking time
from time import time
from datetime import datetime

from fracspy.detection.matched_filtering import *
from fracspy.visualisation.Plotting_Detected_Events import *
# sphinx_gallery_thumbnail_number = 3
Constants#
target_month = 11
target_day = 22
target_hour = 1

NUMBER_OF_TEMPLATES =20

TEMPLATE_DURATION = 4      #: Duration of each template (in seconds)
CORRELATION_THRESHOLD = 0.75         #: Define a threshold for maximum correlation to filter significant results
WINDOW_STEP = 1                     #: Step size for the moving window in seconds


station_list = [str(stationID) for stationID in range(1120,1130)]
Read continuous data and previously extracted templates#
Load event catalogue#
# Load the short event catalog from an Excel file.
# Provide URL for the catalogue
catalogue_url = 'https://zenodo.org/records/6826326/files/ToC2ME_catalog.xlsx?download=1'
# Download the file content directly into a DataFrame
response = requests.get(catalogue_url)
# Check if the request was successful
if response.status_code == 200:
    # Load the Excel data directly from the response content
    df = pd.read_excel(pd.io.excel.ExcelFile(response.content))
    print("Data was successfully downloaded and loaded into the DataFrame.")
else:
    print("Failed to download the file. Status code:", response.status_code)
    exit()  # Exit if the download failed
# Filter the DataFrame based on the specified month and day
catalog = df[(df['Month'] == target_month) & (df['Day'] == target_day) & (df['Hour'] == target_hour)]

# Select the largest 20 magnitude events from the catalog.
catalog = catalog.sort_values(by=['Magnitude'], ascending=False).head(NUMBER_OF_TEMPLATES)
/home/runner/work/FraCSPy/FraCSPy/tutorials/1_1_Detection_Matched_Filtering.py:78: FutureWarning: Passing bytes to 'read_excel' is deprecated and will be removed in a future version. To read from a byte string, wrap it in a `BytesIO` object.
  df = pd.read_excel(pd.io.excel.ExcelFile(response.content))
Data was successfully downloaded and loaded into the DataFrame.
Load continuous seismic data#
# Define client
client = Client("IRIS")
# Starting time close to selected event #1
t1 = UTCDateTime("2016-11-22T01:00:00")
# Add more time for inventory grabbing
t2 = UTCDateTime("2016-11-22T02:04:00")
print(f"Time range: {t1} - {t2}")

# Get inventory
inventory = client.get_stations(network="5B", station="*",
                                starttime=t1,
                                endtime=t2)
# Get station codes
station_info = inventory.networks[0].stations
station_codes = []
for station in station_info:
    station_codes.append(station.code)

tr_data = []
start_time = time()
i = 0
for st_code in station_codes:
    if st_code in station_list:
        st = client.get_waveforms(network="5B",
                                  station=st_code,
                                  location="00",
                                  channel="DHZ",
                                  starttime=t1,
                                  endtime=t2)
        tr_data.append(st[0].data)
end_time = time()
print(f"Done! Loading time: {end_time - start_time} seconds")

# Create a numpy array for data
trace_array = np.array(tr_data)
Time range: 2016-11-22T01:00:00.000000Z - 2016-11-22T02:04:00.000000Z
Done! Loading time: 103.66805005073547 seconds
Build Station Templates#
dt = st[0].stats.delta
t = np.arange(t1, t2+dt, dt).astype(datetime)

TEMPLATE_LENGTH = int(TEMPLATE_DURATION * (1/dt) + 1)  #: Total number of samples per template

templates = np.zeros([trace_array.shape[0],NUMBER_OF_TEMPLATES,TEMPLATE_LENGTH])
# Loop over receivers
for tr_i, trace in enumerate(trace_array):
    i=0
    for index, row in catalog.iterrows():
        # Create the extraction time based on the event details in the catalog.
        event_time_str = f"2016-{int(row['Month']):02d}-{int(row['Day']):02d}T" \
                         f"{int(row['Hour']):02d}:{int(row['Minute']):02d}:" \
                         f"{int(row['Second']):02d}.000000Z"
        event_time = obspy.UTCDateTime(event_time_str)
        # Matching catalogue to trace time
        event_time_index = np.where(t==event_time)[0][0]
        # Trace Segment
        template = trace[event_time_index:event_time_index+TEMPLATE_LENGTH]
        template /=  np.max(np.abs(template))
        templates[tr_i,i] = template
        i+=1
Plotting#
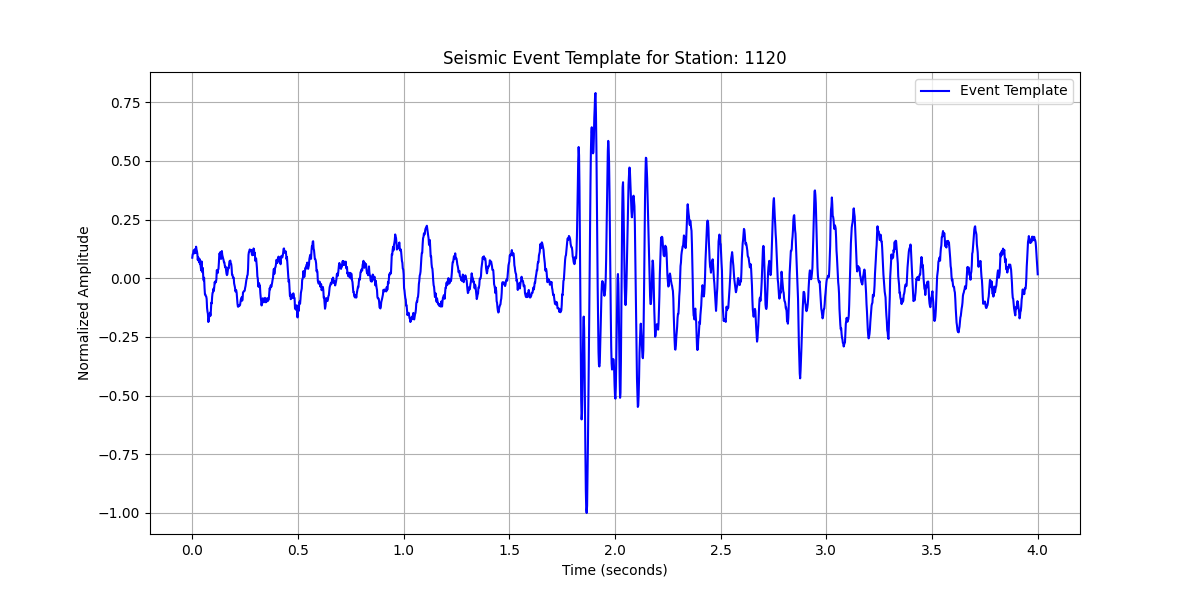
# Select one template to plot; here we take the first one as an example
example_template = templates[0][0]

# Generate a time axis for the template
time_axis = np.linspace(0, TEMPLATE_DURATION, len(example_template))

# Plotting the example template
plt.figure(figsize=(12, 6))
plt.plot(time_axis, example_template, label='Event Template', color='b')
plt.title(f'Seismic Event Template for Station: {station_list[0]}')
plt.xlabel('Time (seconds)')
plt.ylabel('Normalized Amplitude')
plt.grid()
plt.legend()
plt.show()

Matched Filtering (Cross-correlation)#
results_dict = []
for tr_index,trace in enumerate(trace_array):
    station_name = station_list[tr_index]
    print(f"Using Station: {station_name}")

    # Filter template paths to get only those that match the current station's templates
    trace_templates = templates[tr_index]

    # Ensure we have corresponding templates for the current station
    if len(trace_templates)==0:
        print(f"No template files found for station: {station_name}")
        continue  # Skip to the next data file if no templates are available

    # Call the function to perform matched filtering
    trace_results_dict = matched_filtering(trace,
                                             trace_templates,
                                             dt,
                                             station_name,
                                             t1,
                                             TEMPLATE_DURATION,
                                             TEMPLATE_LENGTH,
                                             WINDOW_STEP,
                                             CORRELATION_THRESHOLD)

    results_dict.append(trace_results_dict)
    # Print the number of detected events for the current station
    print(f"Number of detected events for {station_name}: {len(trace_results_dict)}\n")
Using Station: 1120
Number of detected events for 1120: 25

Using Station: 1121
Number of detected events for 1121: 19

Using Station: 1122
Number of detected events for 1122: 18

Using Station: 1123
Number of detected events for 1123: 18

Using Station: 1124
Number of detected events for 1124: 17

Using Station: 1125
Number of detected events for 1125: 19

Using Station: 1126
Number of detected events for 1126: 18

Using Station: 1127
Number of detected events for 1127: 24

Using Station: 1128
Number of detected events for 1128: 20
Plotting Detected Events#
if trace_results_dict:  # Check if there are detected events
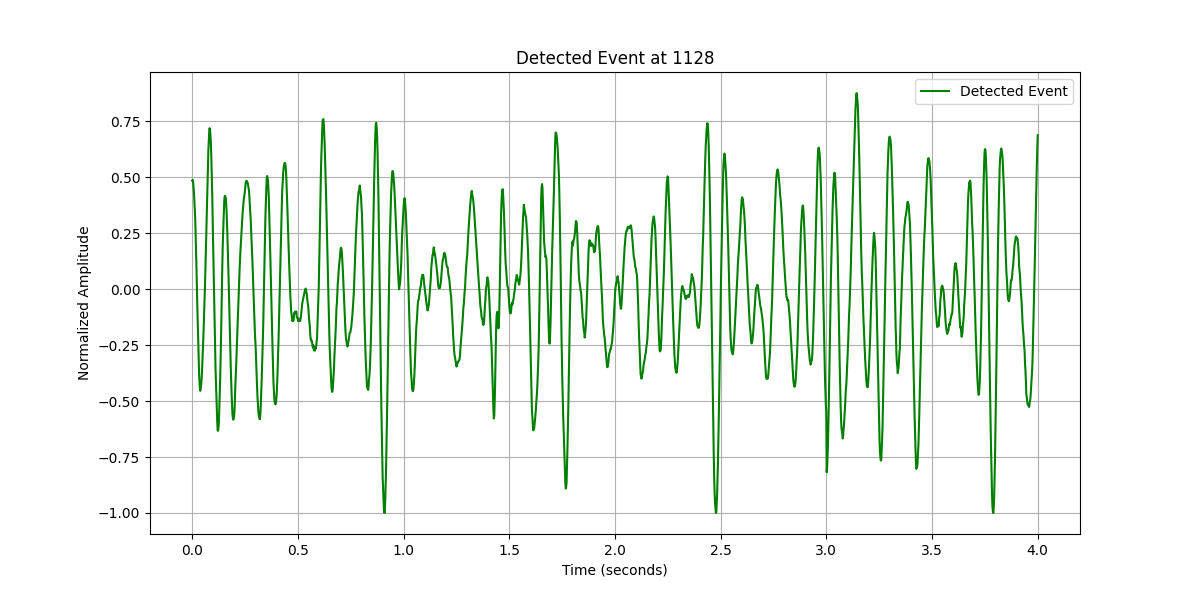
    # Select the first detected event for demonstration
    first_event_time = list(trace_results_dict.keys())[0]  # Using the first event's start time
    event_info = trace_results_dict[first_event_time]

    # Calculate the start and end time for the event
    event_start_time = obspy.UTCDateTime(first_event_time)
    event_end_time = event_start_time + TEMPLATE_DURATION

    event_start_time_index = np.where(t==event_start_time)[0][0]
    event_end_time_index = np.where(t==event_end_time)[0][0]

    # Extract the segment of continuous data corresponding to the detected event
    event_data_array = trace_array[0][event_start_time_index:event_end_time_index]
    event_data_array /= np.max(np.abs(event_data_array))  # Normalize to max absolute value of 1

    # Create a time axis for plotting
    time_axis = np.linspace(0, TEMPLATE_DURATION, len(event_data_array))

    # Plotting the detected event and its correlation value
    plt.figure(figsize=(12, 6))
    plt.plot(time_axis, event_data_array, label='Detected Event', color='g')
    plt.title(f'Detected Event at {station_list[tr_index]}')
    plt.xlabel('Time (seconds)')
    plt.ylabel('Normalized Amplitude')
    plt.legend()
    plt.grid()
    plt.show()
else:
    print(f"No events detected for {station_list[tr_index]}.")

Associate Detected Events Across Stations#
This part of the code loads the results of detected seismic events saved in JSON format, associates detected events across different stations based on their timestamps, and saves the results containing only events detected by at least two stations within a specified time window.
# Call the function to associate detected events
associated_events = associate_detected_events(results_dict,time_window=4,num_station=3)

# Print out the associated events for review
print(f"\nNumber of associated detected events: {len(associated_events)}")
Number of associated detected events: 20
Plotting Associate Detected Events Across Stations#
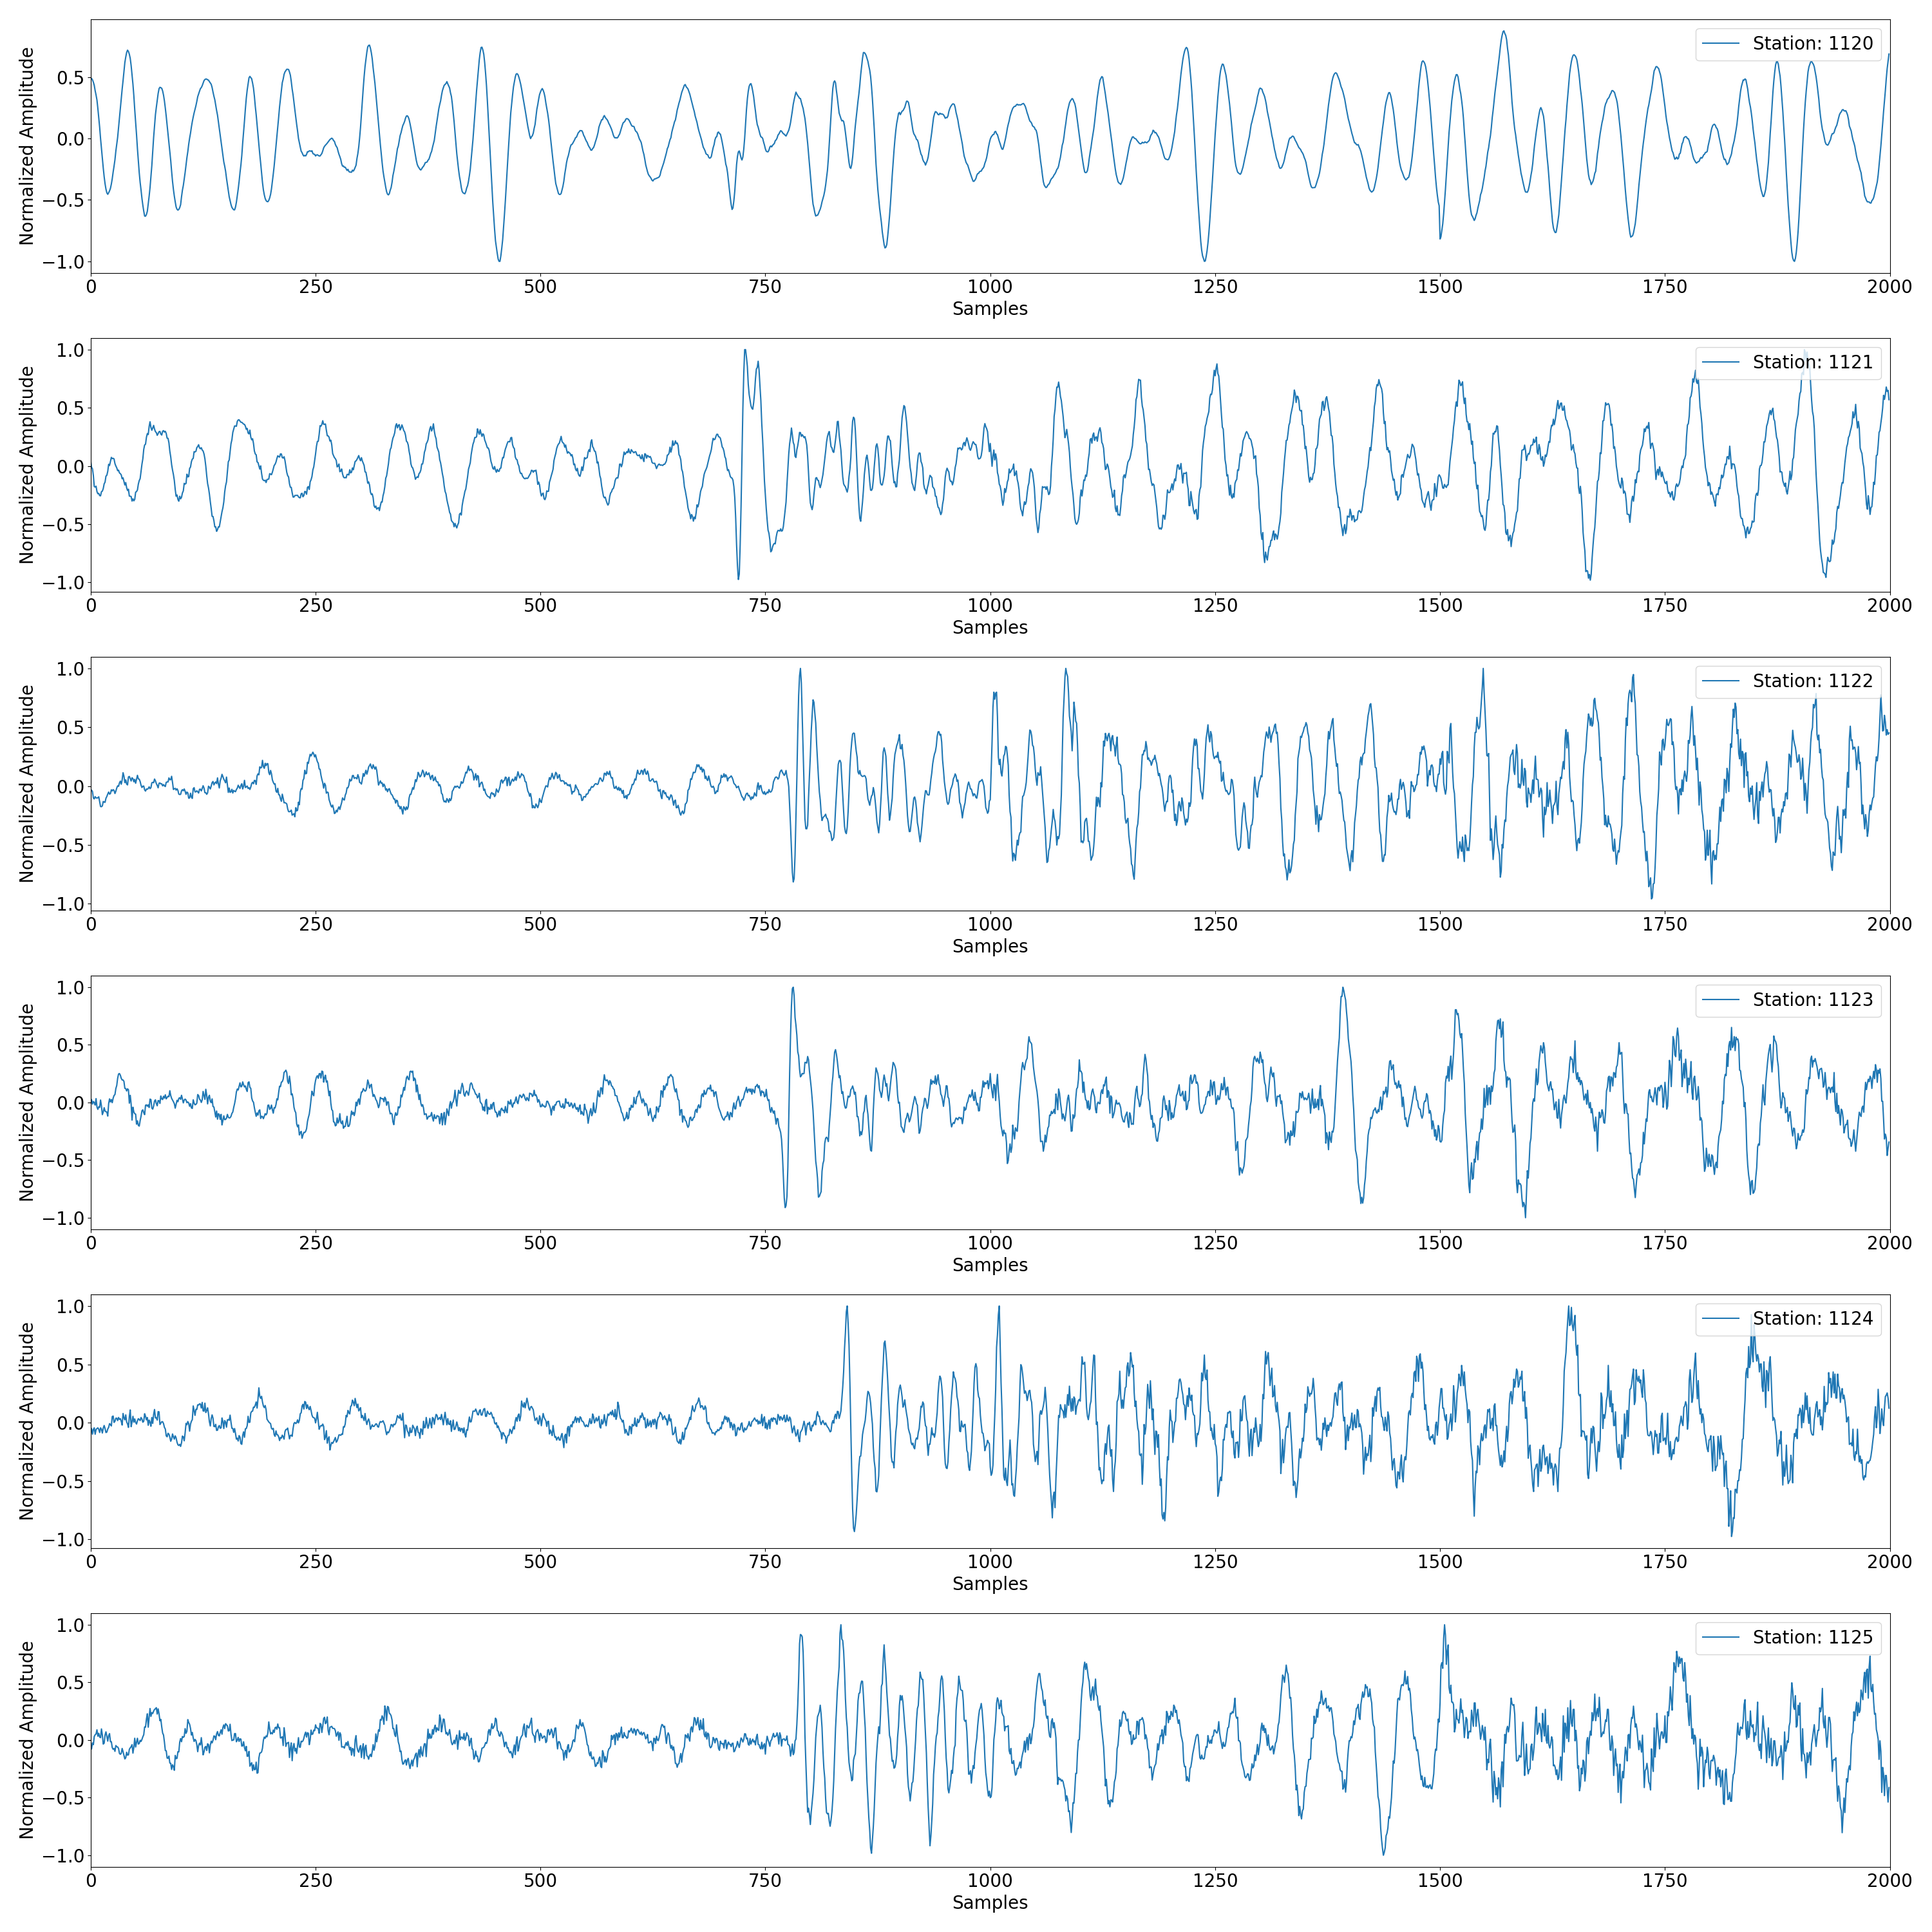
Preparing the data and the first detected event as an example
t0 = obspy.UTCDateTime(associated_events[0]['time'])
# Sample Index of the Detected Time
sample_index = int((t0-st[0].stats.starttime)*st[0].stats.sampling_rate)
# Extracting the Data
tr_data = trace_array[:,sample_index:sample_index+4*int(st[0].stats.sampling_rate)]
# Plot the data segments.
num_stations_to_plot = 6
plot_station_data(tr_data, station_list, num_stations_to_plot)

Total running time of the script: (12 minutes 26.988 seconds)
